LeafletJS: A Lightweight Library to Create Interactive Maps
Contents
- Introduction
- Getting Started
- Key Features
- An Example Use Case
- Conclusion
- References and Further Reading
Introduction
Interactive maps provide engaging ways to visualize geographic data. In this post, we explore how LeafletJS’s lightweight design and flexibility can help you integrate dynamic maps into your website with minimal setup.
LeafletJS is designed with simplicity and performance in mind. It:
- Supports touch and mobile-friendly interactions.
- Offers smooth panning and zooming.
- Provides an extensible framework through a variety of plugins.
Its minimalistic approach makes it a preferred choice over more complex mapping libraries for many developers.
This post will walk you through the basics of LeafletJS—from setting up your environment to adding advanced interactivity to your map.
Getting Started
Installation
You can include LeafletJS in your project using a Content Delivery Network (CDN). Add the following lines to your HTML’s <head> section:
<link rel="stylesheet" href="https://unpkg.com/leaflet/dist/leaflet.css" />
<script src="https://unpkg.com/leaflet/dist/leaflet.js"></script>
Loading a basic map
Step 1: Write the HTML Boilerplate with LeafletJS included
Create a basic HTML page using the code shown below. Don’t forget to include and load the LeafletJS API in the head of the HTML file.
<!DOCTYPE html>
<html>
   <head>
   </head>
    <link
        rel="stylesheet"
        href="https://unpkg.com/leaflet@1.9.4/dist/leaflet.css"
      />
    <script
        src="https://unpkg.com/leaflet@1.9.4/dist/leaflet.js"
    ></script>
   <body>
      This is where the main body goes...
   </body>
</html>
- Pro Tip: On VS Code, you can just type
docand press Enter to instantly create the boilerplate code!
Step 2: Create the container which will contain the map
To hold the map, we can create a generic container element using the <div> tag –
<div id = "map" style = "width:1000px; height:500px;"></div>
Step 3: Defining Map Options
Before creating the map, it’s a good practice to define your map options. The mapOptions object can include properties like the initial center coordinates and the zoom level. For example:
var mapOptions = {
   center: [23.211, 72.687],
   zoom: 16
};
Step 4: Creating the Map Object
To create a map on your page, you can use the Map class of the Leaflet API. It takes in two arguments:
- a String variable representing the ID of the
<div>instance, which in this case is an HTML container. - An object literal with map options [optional]
var map = new L.map('map', mapOptions [optional]);
Step 5: Adding Layers
When working with mapping libraries, “layers” represent collections of objects displayed on the map. These layers can contain markers, polylines, polygons, or other map features.
Create the tile layer object as shown below
var layer = L.tileLayer('https://{s}.tile.openstreetmap.org/{z}/{x}/{y}.png');
To add this layer to your map:
map.addLayer(layer);
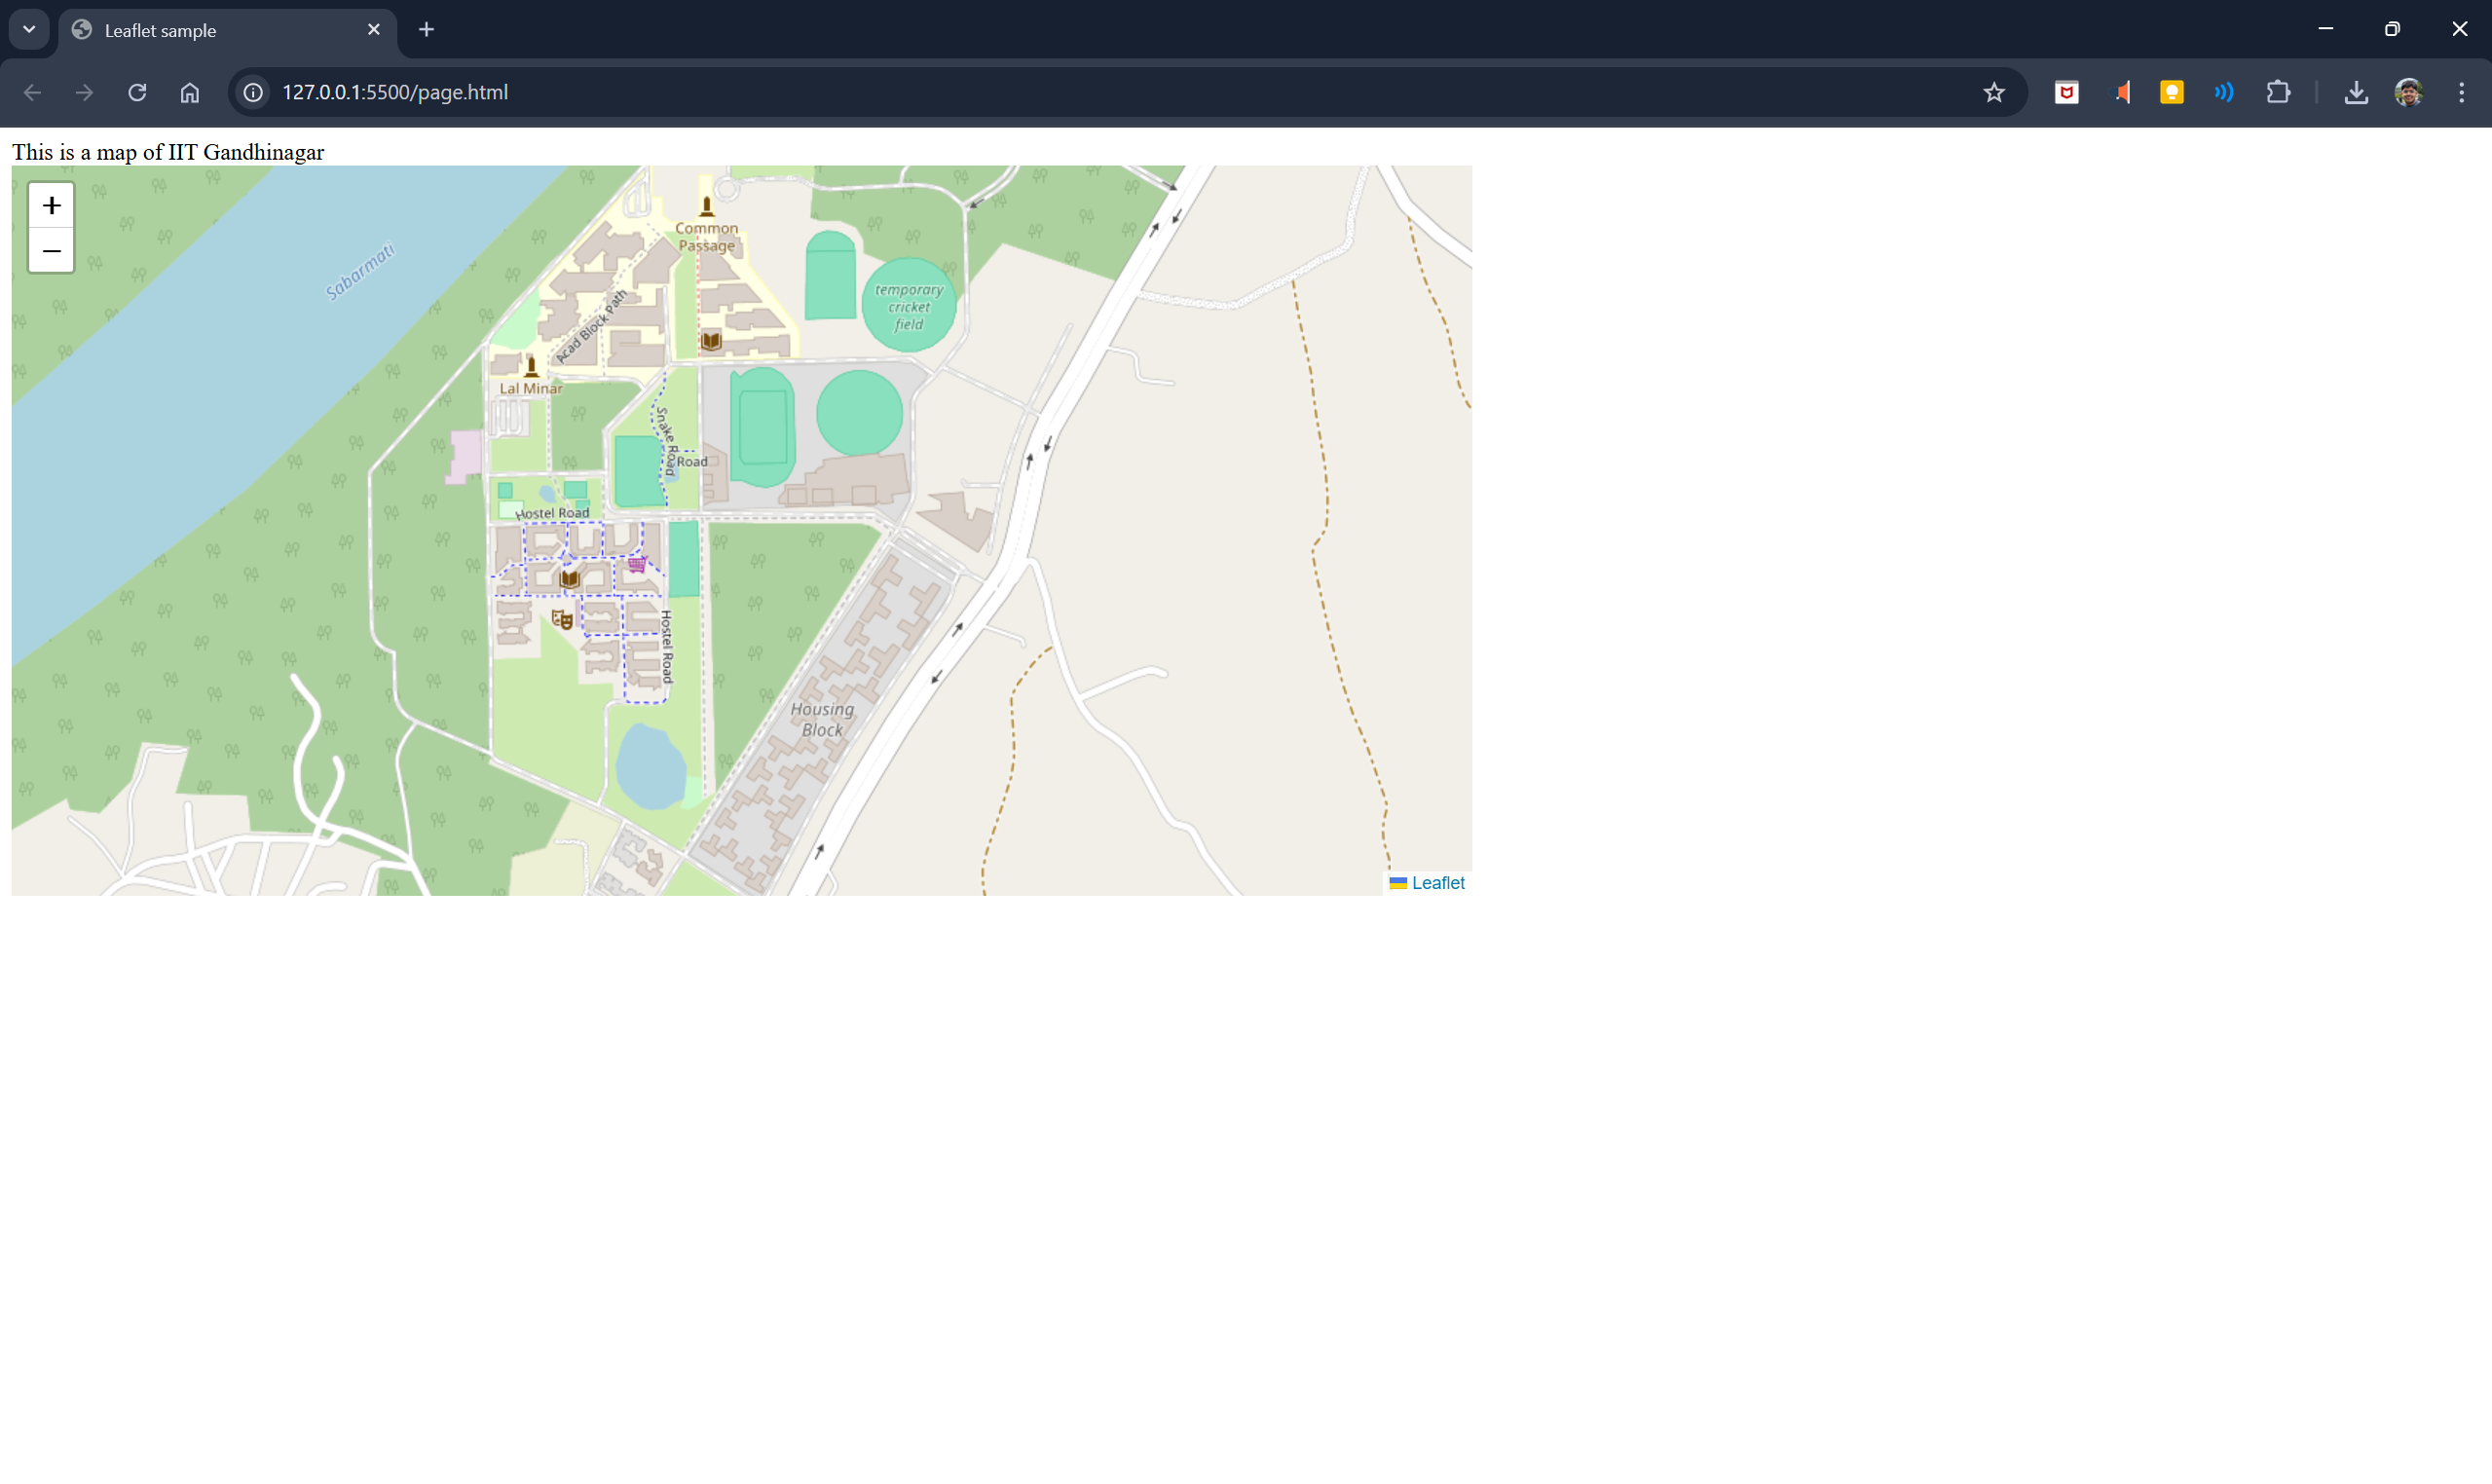
If you perform the above steps correctly, you should see the following output:
Key features
LeafletJS comes packed with an extensive set of features that make it a powerful choice for creating interactive maps. From basic markers to complex data visualizations, its modular architecture allows developers to implement sophisticated mapping solutions with minimal code. Here are some of the notable features:
Map Methods
LeafletJS provides built-in mechanisms to control map behavior. You can easily zoom in and out, set or query the current zoom level, and adjust the view by fitting the map bounds to a specific geographic area.
Markers and Custom Icons
Markers allow you to pinpoint specific locations on the map. You can use standard markers or define custom icons to emphasise particular points as well.
Popups
Popups allow you to show additional information about a location when a user interacts (click/hover) with the map.
Tooltips
Tooltips are used for displaying brief descriptive text when a user hovers over a marker or layer. This feature provides context-sensitive information without cluttering the map.
Vector Layers
LeafletJS supports various vector layers for drawing shapes and paths:
- Polylines: Represent sequences of connected lines.
- Circles: Create round shapes using a defined center and radius.
- Polygons: Draw multi-sided shapes, useful for outlining areas.
GeoJSON Layers
The library can render GeoJSON data to display complex geospatial features. This is particularly useful for combining diverse geographical data with interactive mapping features.
(GeoJSON has been discussed in further detail in the upcoming section)
Other Useful Features:
- Layer Groups: Organize and manage multiple markers or layers as a single unit.
- Event Handling: Listen and respond to events like zoom changes, clicks, or mouse movements for an enhanced map experience.
- Control Layers: Add widgets that allow users to toggle between different base maps or overlay data.
An Example Use-Case
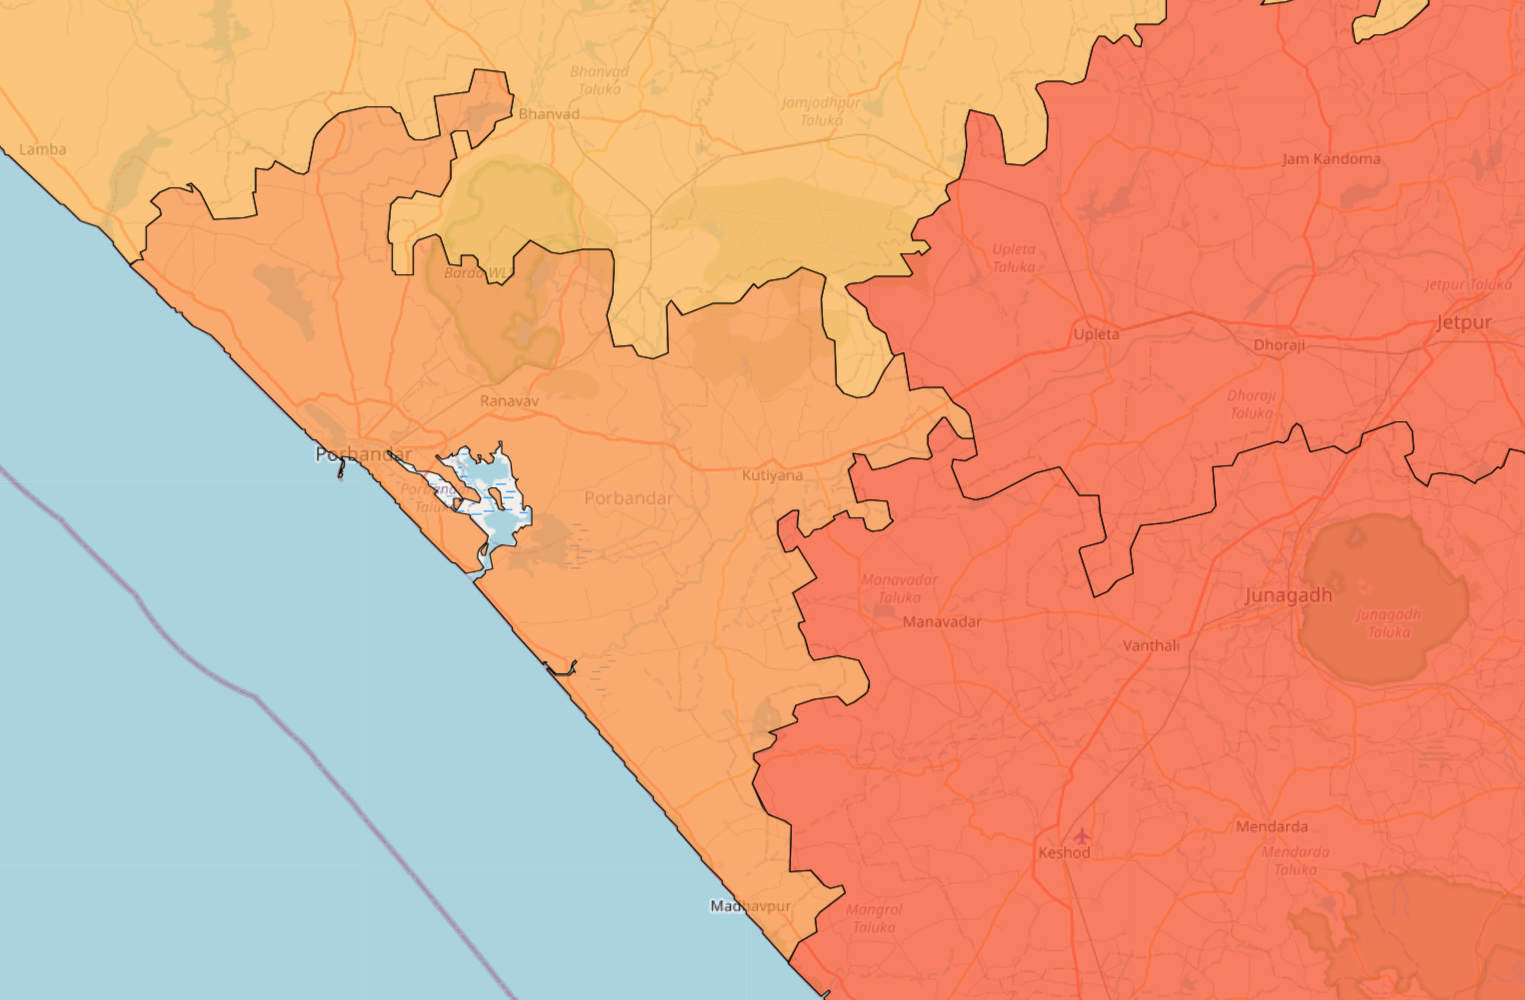
Practical application of LeafletJS is quite vast. Especially, it can be leveraged amazingly well in the field of data visualisation. For example, we can visualise the population demographics of a particular area. Here is one such implementation:

The above shown choropleth map not only visualizes the distribution of population density across districts but also serves as an interactive tool for deeper analysis. With LeafletJS, you can enhance this map by adding popups and tooltips, allowing users to click on specific districts for additional insights, hence making data visualisation more dynamic and interactive.
Let us dive into the details of the LeafletJS features used in making this map:
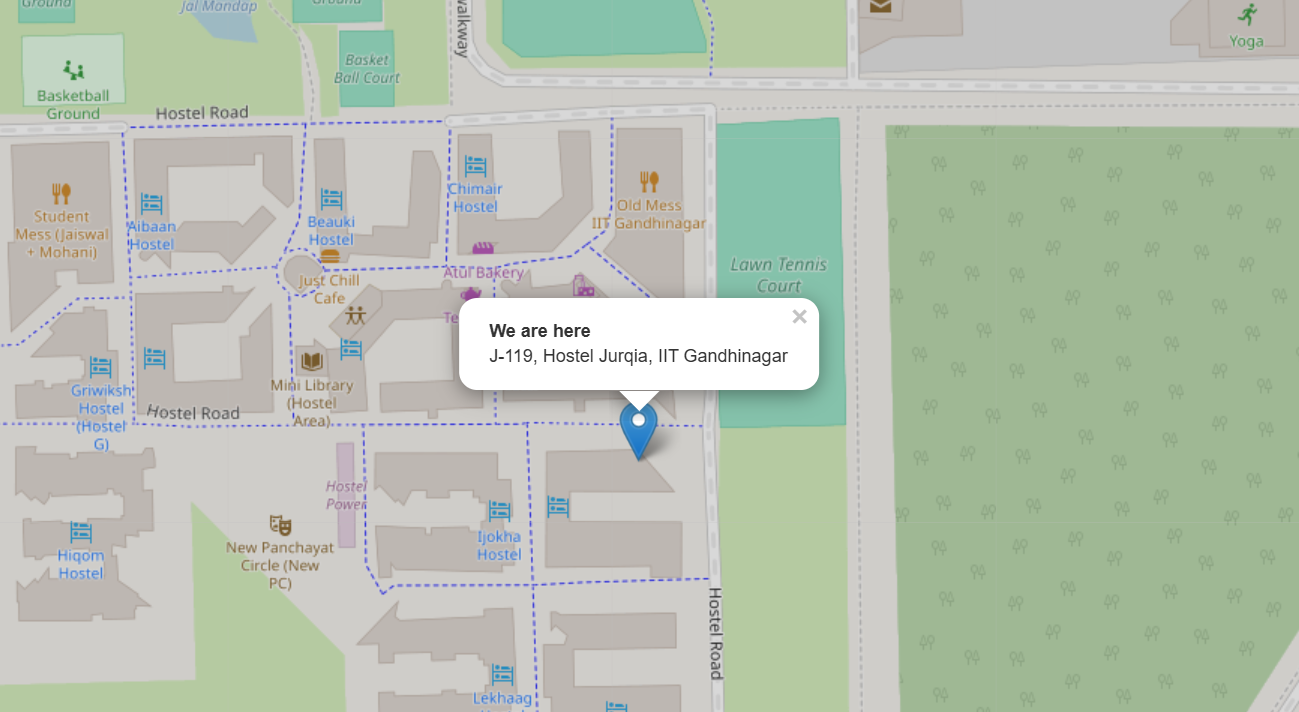
Markers
You can add a marker to any coordinate on the map to mark certain landmarks or points of interest.
const marker = L.marker([latitude , longitude]).addTo(map);
- To add a popup –
marker.bindPopup("Your message goes here");Note: the
.bindPopupmethod is not limited to markers, you can use it with other objects as well.
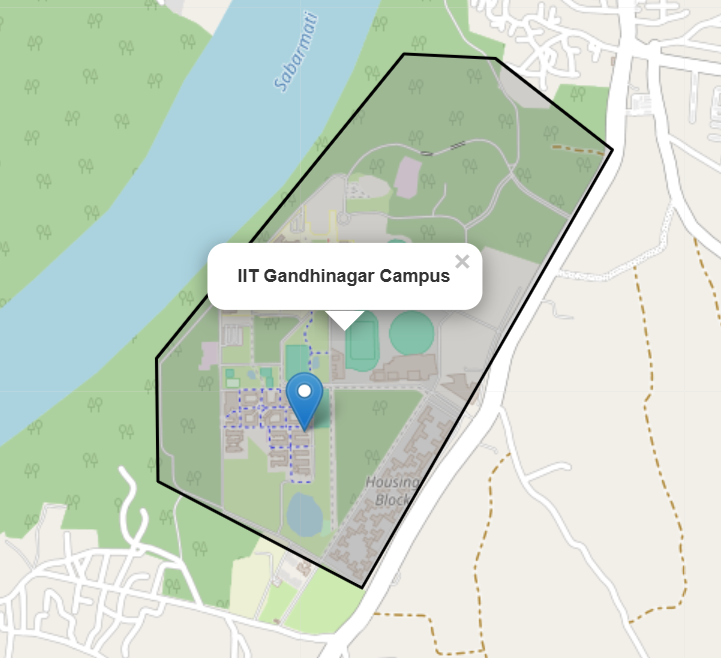
Polygons
You can create a polygon object (or a circle as well, but the syntax will differ) using the following snippet –
const myPolygon = L.polygon([[x1,y1],[x2,y2],[x3,y3],...], polygonOptions).addTo(map);
Within polygonOptions, you can provide options like color, weight, opacity, etc.
Search Bar
Geocoding Search is a feature in Leaflet Geocoder that allows users to search for any place on the map by typing its name in the search bar.
Do note that you would have to include the Leaflet Control Geocoding CSS script in the <head> and <body> in order to use this feature.
<link rel="stylesheet" href="https://unpkg.com/leaflet-control-geocoder/dist/Control.Geocoder.css" />
To add the search option on the map –
L.Control.geocoder().addTo(map);
However, note the following customisations that you may need to make, depending on your use:
- By default, Geocoder adds a marker to the resultant coordinate of the search
- If you want the map to zoom to the location you searched up (which would be the case most of the time), you would need to create a function for that.
Here’s you to take care of these issues:
L.control.geocoder({
    defaultMarkGeocode: false  // Prevents automatic marker
})
.on('markgeocode', function(e) { // Adjusts the map to the bounding box of the location
    const bbox = e.geocode.bbox;
    map.fitBounds(bbox);
.addTo(map);
GeoJSON
One of the key features in Leaflet is the ability to load GeoJSON files.
- About GeoJSON:
GeoJSON is an open standard format designed for representing simple geographical features (like points, lines and polygons) along with their non-spatial attributes (like name of a particular polygon). It is based on a human-readable text format called JSON (JavaScript object notation) and is widely used on the web.
Here is how the district borders were defined on the map:
fetch('gujarat.geojson')
    .then(response => response.json())
    .then(data => {
        const densityLayer = L.geoJSON(data, { // Create new geoJSON layer
            style: funct,
            onEachFeature: (feature, layer) => {
                layer.bindPopup(`
                    <b>${feature.properties.NAME_2}</b><br>
                    Density: ${densityData[feature.properties.NAME_2]} per km²
                `);
            }
        }).addTo(map);
Conclusion
In conclusion, LeafletJS offers an accessible and efficient way to incorporate interactive maps into your projects. Its simplicity, combined with extensive customization options, makes it a top choice for developers who value both performance and user experience. Whether you’re building a small personal blog or a complex application, LeafletJS provides the essential tools to bring your map visualizations to life.
References and Further Reading
- MapTiler is a Swiss provider of custom online maps for websites and applications. Their guides were helpful in creating this blog.
- Tutorials Point on LeafletJS
- Also check out the Leaflet API for documentation: LeafletJS Official Documentation